The design assumption embedded in every aging distribution transformer is unidirectional power flow: current flows from the substation, down the feeder, through the transformer secondary, and out to customers. The transformer's thermal and mechanical design, its insulation sizing, its loading curve, and its expected aging trajectory were all set with that assumption. Distributed energy resources — rooftop solar, battery storage systems, EV charging aggregations — violate that assumption in ways that have real consequences for asset condition and failure risk.
DERMS (Distributed Energy Resource Management Systems) have become the operational platform for managing these bidirectional flows. As DERMS deployments mature and utilities gain more real-time visibility into DER generation and dispatch, there is an underutilized integration opportunity: using DERMS telemetry as a contextual input to distribution asset condition monitoring. The goal is to correctly account for DER-driven loading patterns that otherwise appear as anomalies in a monitoring model calibrated on traditional unidirectional load.
How DERs Change the Loading Profile
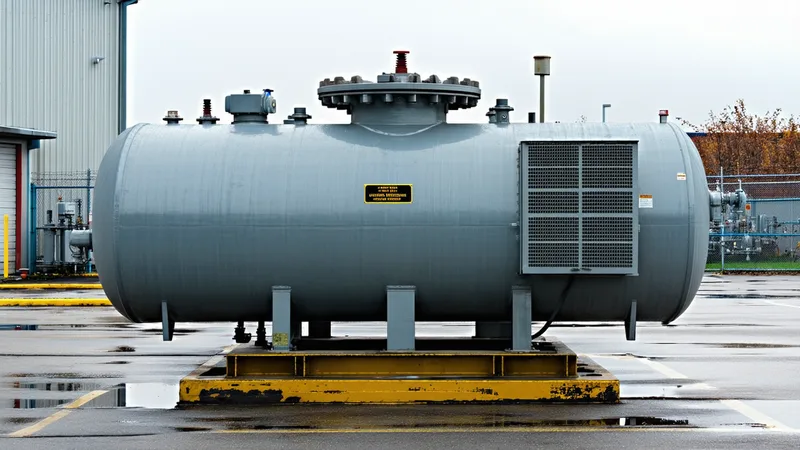
A residential distribution transformer in a high-solar penetration neighborhood experiences a loading pattern that a transformer installed 20 years ago was never designed for. During midday peak solar generation, net load through the transformer may be near zero or even reversed as generation flows back up the secondary. During the evening peak — when customers return home, plug in EVs, and solar generation has dropped off — the transformer experiences a rapid ramp-up in load that can reach or exceed nameplate rating within a 30-60 minute window.
This "solar duck curve" loading pattern creates two specific stresses that traditional loading analysis misses. First, the thermal cycling frequency is higher — the transformer experiences significant temperature swings within a single day rather than a gradual build to peak and recovery overnight. Thermal cycling has been shown in IEEE C57.91 research to accelerate certain modes of winding insulation stress beyond what the steady-state Arrhenius model alone would predict. Second, the reversed current flow through the secondary conductors during export events creates Lorentz forces on the winding structure in the direction opposite to the traditional design loading — a mechanical stress regime the transformer was not designed for.
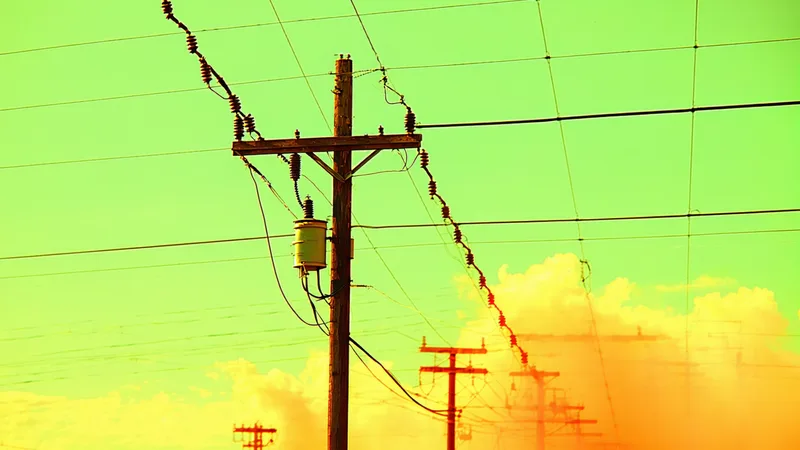
For step voltage regulators, DER penetration creates a second problem: significantly increased tap change activity. A step regulator in a high-solar feeder must compensate for voltage swings caused by variable generation output, which can drive 3x to 5x more tap operations per day than the same regulator would perform on a traditional load feeder. As we covered in our earlier article on tap-changer wear, operation count is the primary driver of contact wear, and a regulator accumulating five times the expected daily tap operations is consuming its maintenance interval five times faster than the rating tables assume.
Why Standard Condition Monitoring Baselines Break Down
A condition monitoring model calibrated on pre-DER loading data will systematically flag DER-affected transformers as anomalous during normal DER operation. The vibration signature and thermal profile of a transformer experiencing bidirectional load swings looks different from the same transformer operating under traditional load — not because anything is wrong, but because the operating regime has changed.
This is the specific integration problem that DERMS data helps solve. If the condition monitoring platform knows that the DER penetration level on a specific feeder segment has increased over the past 12 months (information available from the DERMS as interconnection queue data or from real-time DER dispatch telemetry), it can update the baseline model's expected operating regime for the affected transformers. The anomaly detection question becomes "is this transformer behaving abnormally for a transformer operating under this specific DER loading pattern?" rather than "is it behaving abnormally relative to a pre-DER baseline that no longer applies?"
The DERMS Integration Data Model
What data does the condition monitoring platform need from the DERMS to perform this recalibration? The minimum useful inputs are:
- Feeder-level DER penetration: Total nameplate DER capacity interconnected on each feeder, expressed as a percentage of the feeder's peak load. This static parameter allows the monitoring model to classify feeders into DER penetration tiers and apply appropriate baseline adjustments by tier.
- Real-time or near-real-time net load at the transformer secondary: The signed net load (positive for net import, negative for net export) allows the thermal model to correctly account for the loading regime the transformer is actually experiencing, rather than assuming the sign of power flow.
- DER dispatch events: Timestamps of large, rapid DER curtailment or dispatch events (battery discharge cycles, demand response events) that cause step changes in feeder loading. These events produce thermal and vibration signatures that should not be flagged as anomalies — they are expected operating events.
The DERMS integration does not need to be real-time. A 15-minute batch update of net load and a daily update of DER event logs is sufficient for the thermal model recalibration and for filtering DER-driven operating events from the anomaly detection pipeline.
A Practical Example: High-Solar Suburban Feeder
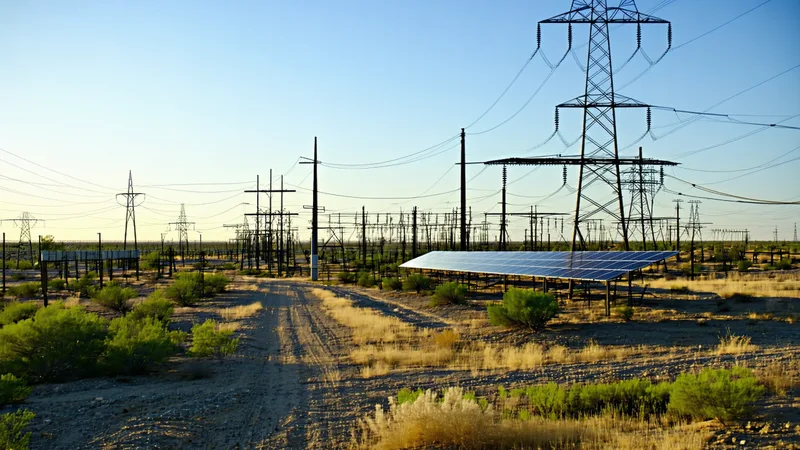
Consider a distribution feeder in a high-growth suburban corridor in central Texas, serving a mix of residential customers with rooftop solar and EV charging. Total interconnected solar capacity on the feeder has grown from approximately 200 kW in 2020 to over 2 MW by 2025, with interconnection applications pending for an additional 500 kW. The feeder's peak load is approximately 4 MW, putting solar penetration at 50%+ of peak load.
Without DERMS context, the Fieldiq anomaly model for transformers on this feeder would observe an unusual operating pattern: net secondary loads near zero during midday, rapid ramp-up in the late afternoon, and vibration signatures that change character during the transition periods as the current direction shifts. Without knowing this is driven by normal DER behavior, those signatures could generate anomaly flags that field teams would quickly learn to dismiss — training them to ignore the alert queue more broadly.
With DERMS net load data integrated as an operating context covariate, the model correctly conditions its anomaly detection on the DER-influenced load regime. Midday near-zero load is expected; the vibration signature during that period is compared to baseline observations under comparable low-load DER conditions. The rapid evening ramp-up is expected; the thermal model accounts for the higher instantaneous loading rate. Anomaly flags on this feeder reflect genuine mechanical or thermal deviations from expected condition — not expected consequences of DER operation.
The Asset Lifecycle Planning Angle
Beyond real-time anomaly detection, the DERMS integration data has value for distribution asset lifecycle planning. Transformers and regulators on high-DER-penetration feeders have different forward-looking aging trajectories than equivalent assets on traditional load feeders. The loss-of-life acceleration from higher thermal cycling frequency, combined with the accelerated tap-changer wear from voltage regulation demand, means these assets may reach end-of-life 5–10 years earlier than the standard fleet average would suggest.
A planning function that overlays DERMS interconnection queue data (approved and pending DER applications by feeder) with asset age and condition data produces a forward-looking view of which circuits will experience accelerated asset aging as DER penetration continues to grow. This is the intersection of DERMS planning and distribution asset management that most utilities have not yet connected — the DERMS team manages the DER queue, the asset management team manages the transformer and regulator fleet, and neither has full visibility into what the other's decisions mean for the other's planning problem.
Condition monitoring that integrates DERMS context begins to bridge that gap — not by solving the organizational coordination problem (which is a separate challenge), but by making the data connection between DER loading impact and asset aging trajectory available in the system that reliability engineers already use to manage their maintenance programs.